How to measure training effectiveness: is your learning content working?
Go beyond completion rates and measure training effectiveness with in-content feedback, NPS and CSAT.

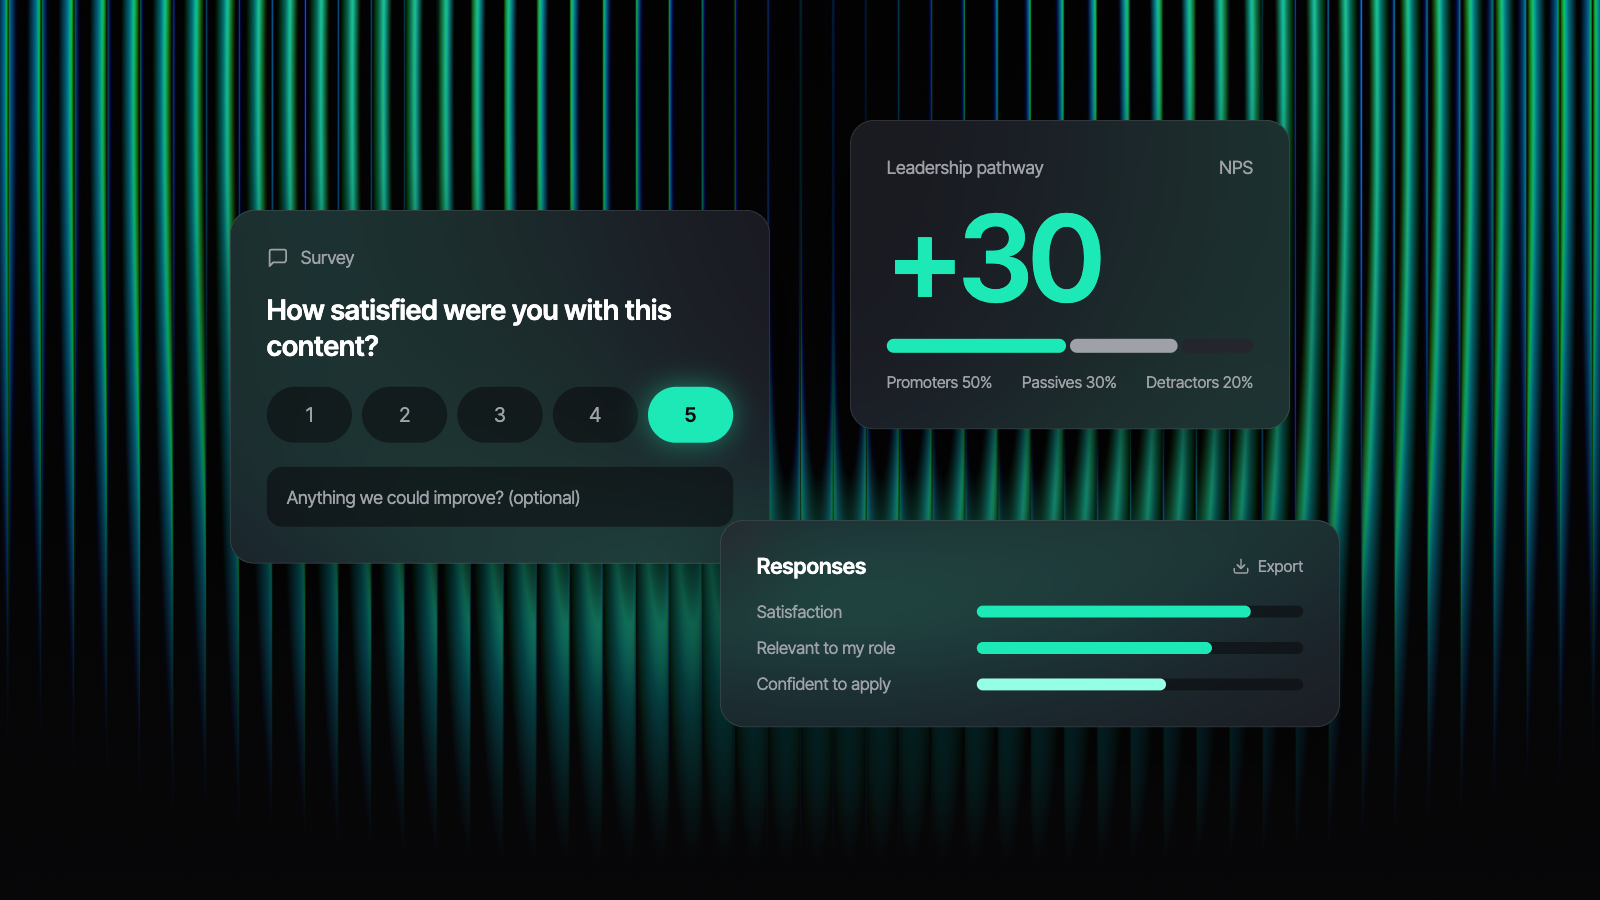
How do you measure the effectiveness of a training programme? Not just completions, but whether the training is making a real difference?
You spend months – or maybe more recently, minutes? – working on your learning content, and you obviously want your people to interact with it. But beyond that, the content needs to shift from something passively consumed to something actively used. Increasingly, L&D teams are expected to show how learning supports performance. It’s no longer enough to show off impressive completion rates and call it a day.
And while a 94% completion rate is, of course, nice to have, it doesn’t tell you whether anyone found the learning useful or actionable. It doesn’t show you whether it helped with the practical parts of the job, like dealing with a difficult customer or closing a sales call.
A reliable way to measure training effectiveness is to combine usage data with feedback collected inside the content itself. This guide walks through how to do that with in-content training feedback surveys, NPS and CSAT, and how to turn what you collect into clear decisions about which content to keep or retire.
Why completion rates aren’t enough to measure training effectiveness
Completion rates have an understandable origin story. They’re useful for tracking compliance and tracking where people drop off, which is why they sit at the centre of so many L&D reports. Completion rates measure behaviour, though, and that behaviour can be driven by something as simple as a manager asking for a screenshot of a certificate, which doesn’t really say anything about the quality or effectiveness of the content itself.
A course can have a near-perfect completion rate and still teach people very little. Meanwhile, there’s an unassuming little ‘how-to’ video that people return to again and again, dipping in and out without making a single dent on your completion reports. But that’s the resource your team relies on when they need a quick reminder, and it’s what is actually making a difference in their day-to-day working lives.
Other common metrics to measure training effectiveness have similar blind spots:
Time spent can mean someone is engaged or that they’re lost.
Quiz scores show what people remembered directly after consuming the content, rather than whether they found it relevant to their role.
To get a fuller picture of your L&D metrics, you need a measure of how learners experienced the content, captured close enough to the moment that their answers are specific and honest.
This kind of feedback sits at Level 1, Reaction, of the Kirkpatrick Model, one of the most widely used frameworks for evaluating training. The higher levels look at what people learned, whether their behaviour changed and the results for the business, all the way through to the ROI of employee training. Reaction data won’t answer those questions on its own, but it’s the quickest to collect, and it shows you which content is worth building on.
Collecting training feedback in the moment
Speed is key.
Traditionally, a training evaluation survey arrives by email a few days after the course ends, by which point people have moved on to other things. Not to mention that the response rates tend to be low, and the answers you do receive are general impressions instead of specific details.
Building a training feedback survey directly into the content solves these problems.
Put a short survey between two sections of a longer pathway and people answer while the experience is fresh, without having to leave what they're doing. (Don’t underestimate the power of people not having to leave what they’re doing.)
You also know exactly which piece of content each response relates to, so a low score shows you where to look.
A few principles help keep in-content feedback useful:
- Keep it short. People will not feel moved to respond to a ten-question form requiring lengthy, detailed answers. Opt instead for something shorter – think one rating question and one optional comment box.
- Ask at natural break points. Nestle your question inside a pause, like the end of a lesson or a natural break in a longer pathway. Don’t try to muscle your way into the middle of a module; it’ll only result in distracted annoyance.
- Use the same questions consistently. Stick to a set of standard course evaluation questions that let you compare content across your whole library. This will help you rank what’s working.
- Always include space for comments. Scores tell you where to look, and comments usually tell you what to fix.
If you need a starting point, these training feedback questions work well in a post-training survey. Pick one or two rather than using them all:
- How satisfied were you with this content? (1 to 5)
- How likely are you to recommend it to a colleague? (0 to 10)
- How relevant was this content to your role?
- How confident do you feel putting what you’ve learned into practice?
- What’s one thing we could improve? (optional comment)
With Thrive, you can drop a survey block into any piece of content in the Content Creator and mix it in with your other blocks, so feedback is collected inside the learning experience and tied directly to the content it’s about.
You can choose from multiple choice, multi-select, free text, Likert scale and NPS questions, and decide which ones learners have to answer. Because learners can’t complete the content until they’ve answered your required questions, you hear from everyone who takes part rather than just the few who choose to fill in a form afterwards.
Every response then lands in a responses tab on the content item, where you can see a summary alongside per-question results and export them for further analysis.
Using NPS for learning content
Net Promoter Score (NPS) was designed to measure customer loyalty, but the same question works well for learning content. You ask people how likely they are to recommend a course or pathway to a colleague, on a scale from 0 to 10.
Responses fall into three groups. People who answer 9 or 10 are Promoters, 7 and 8 are Passives, and anything from 0 to 6 counts as a Detractor. Your score is the percentage of Promoters minus the percentage of Detractors, which gives a number between -100 and +100. For example, if 50% of responses are Promoters and 20% are Detractors, your NPS is +30.
NPS for training is most useful when you're looking at content at a higher level, such as a full onboarding programme, a leadership pathway or a learning space built around a skill.
Recommending something to a colleague is a vote of confidence: people tend to do it when they believe the content was worth their time and would help someone in a similar role.
A couple of things to keep in mind when you use it:
- Compare like with like. Mandatory compliance training isn’t going to score as highly as an optional career development pathway, so benchmark content against similar content in your own library.
- Track the trend over time. If a score climbs after you update a course, you know your changes have made a difference.
- Read the comments from Detractors first. They're often the quickest route to the specific problem, whether that's length, relevance or a broken link.
Using CSAT to spot weak content
Customer Satisfaction Score (CSAT) asks a simpler question: how satisfied were you with this content? People usually answer on a 1 to 5 scale, and your score is the percentage of responses that are 4 or 5.
Where NPS works well for programmes and pathways, CSAT for learning is better suited to individual pieces of content. Because the question is quick to answer, you can place it at the end of every module, video or article without asking too much of people, and you'll build up enough responses to compare content at a granular level.
That’s what makes CSAT so useful for finding weak spots. Sort your content by score and the lowest performers stand out quickly. From there, a few patterns are worth looking for:
- Low satisfaction on high-traffic content. These are your priority fixes, because a large number of people are having a poor experience.
- A sudden drop in score. This often means something has changed, such as a process update that's made the content out of date.
- One weak module inside a strong pathway. If people rate everything around it highly, the problem is likely to be that specific piece of content and not the pathway as a whole.
If you're using both measures, a simple rule of thumb is to use CSAT to find problems in individual pieces of content and NPS to judge whether a programme as a whole is landing.
Here’s how the two compare at a glance:
Turning feedback into content decisions
Once responses start coming in, the next step is deciding what to do with them.
The simplest way to make that decision is to look at satisfaction alongside usage. Together, they tell you where to spend your time – for example, a low score on content nobody opens is a much smaller problem than a low score on something every single new starter has to complete.
Once you've lined those two measures up, each piece of content tends to fall into one of three groups:
Keep
Content with strong scores and healthy usage is doing its job.
Leave it alone, apart from routine accuracy checks, and look at what it has in common with your other high performers. Format, length and tone often repeat across your best content, which gives you a useful template for anything new you build.
Fix
Content with weak scores but high usage, or a recent drop in satisfaction, should go to the top of your update list.
Start with the comments, as they'll usually point to the specific issue, and make one change at a time so you can see whether the score improves afterwards.
Retire
Content with low scores and low usage is taking up space in your library and making good content harder to find.
If it isn't required for compliance, archive it. If the topic still matters, it may be quicker to rebuild it from scratch than to fix it – especially with tools like Thrive's AI Content Creator, which gives old, unused material a second life by transforming it into a course, image, video, or podcast.
As your library grows, sorting through feedback by hand gets harder. Kiki Analyse lets you ask questions about your learning data in plain language, so you can quickly find which content is underperforming and why.
Building a regular content review rhythm
A one-off review will tidy up your library for a while, but content goes out of date as policies, products and roles change.
If you instead build a regular rhythm, you’ll pick problems up early and get a steady record of how your content is improving over time.
A cadence that works for many L&D teams looks something like this:
- Monthly: Check CSAT results for any sudden drops and scan new comments, so urgent issues get fixed quickly.
- Quarterly: Review NPS for your main programmes and pathways, and work through your keep, fix and retire list.
- Annually: Audit your full library against business priorities, and retire or rebuild anything that no longer supports them.
It also helps to agree who owns each review. Content often has a Subject Matter Expert behind it, so make use of that expertise by bringing them into the review process. They’ll be able to provide a level of detail you wouldn’t otherwise have, and help you make all the necessary fixes.
Finally, close the loop with your learners. People like to know that their opinions are actually heard, instead of asked for and promptly discarded. Tell them that a course was updated because of their feedback. That tends to lift response rates the next time you ask.
Want to see in-content surveys in action? Book a demo and we’ll show you how to build feedback into your learning content.
Measuring training effectiveness FAQs
How do you measure the effectiveness of a training programme?
Start by combining usage data, such as completions and repeat visits, with feedback collected inside the content. A short training feedback survey at the end of a module or pathway shows how people experienced it, NPS shows whether a programme is worth recommending, and CSAT shows which individual pieces of content need work. For a fuller picture, the Kirkpatrick Model adds measures of learning, behaviour change and business results.
What is a good NPS score for training?
Any score above zero means you have more Promoters than Detractors, which is a reasonable starting point. Beyond that, a good NPS for training depends heavily on the type of content, since optional development programmes usually score higher than mandatory compliance training. The most reliable benchmark is your own library: compare similar pieces of content with each other and track whether scores improve after you make changes.
What’s the difference between NPS and CSAT for training?
NPS asks how likely people are to recommend content to a colleague, on a scale from 0 to 10, and works best for judging whole programmes and pathways. CSAT asks how satisfied people were with a specific piece of content, usually on a 1 to 5 scale, which makes it better for finding weak modules, videos or articles. Many L&D teams use both: CSAT to find problems and NPS to see whether a programme as a whole is landing.
How often should you survey learners?
Short satisfaction questions can sit at the end of every module or piece of content, as long as they take only a few seconds to answer. NPS questions and slightly longer surveys work better at the end of a full programme or pathway. Reviewing the results monthly for content issues and quarterly for programme-level trends gives most L&D teams a manageable rhythm.
How do you avoid survey fatigue?
Keep each survey to one or two questions, use the same questions consistently so people know what to expect, and avoid stacking several surveys into a single session. Showing learners that their feedback has led to changes also makes a real difference, because people are more willing to answer when they can see the results.
How do you calculate the ROI of employee training?
The standard formula is the monetary benefits of the training minus its costs, divided by the costs and multiplied by 100 to give a percentage. The hard part is putting a value on the benefits, so teams usually link learning to a business measure such as sales, error rates or time to competency. Feedback data helps here, because it shows which content people are using and finding useful before you try to connect it to results.
Can Thrive collect feedback inside learning content?
Yes. Thrive lets L&D teams add survey blocks to any content in the Content Creator, using multiple choice, multi-select, free text, Likert scale and NPS questions. Learners can’t complete the content until they’ve answered the required questions, and every response appears in a responses tab on the content item, with a summary and per-question results that can be exported.