Learning analytics and reporting that drives decisions
Track learner progress, measure business impact and generate the LMS reports your stakeholders actually need — all from one learning analytics solution.
.avif)
.avif)

%20-%20Bigger.png)

.png)



Learning management system analytics, built for action
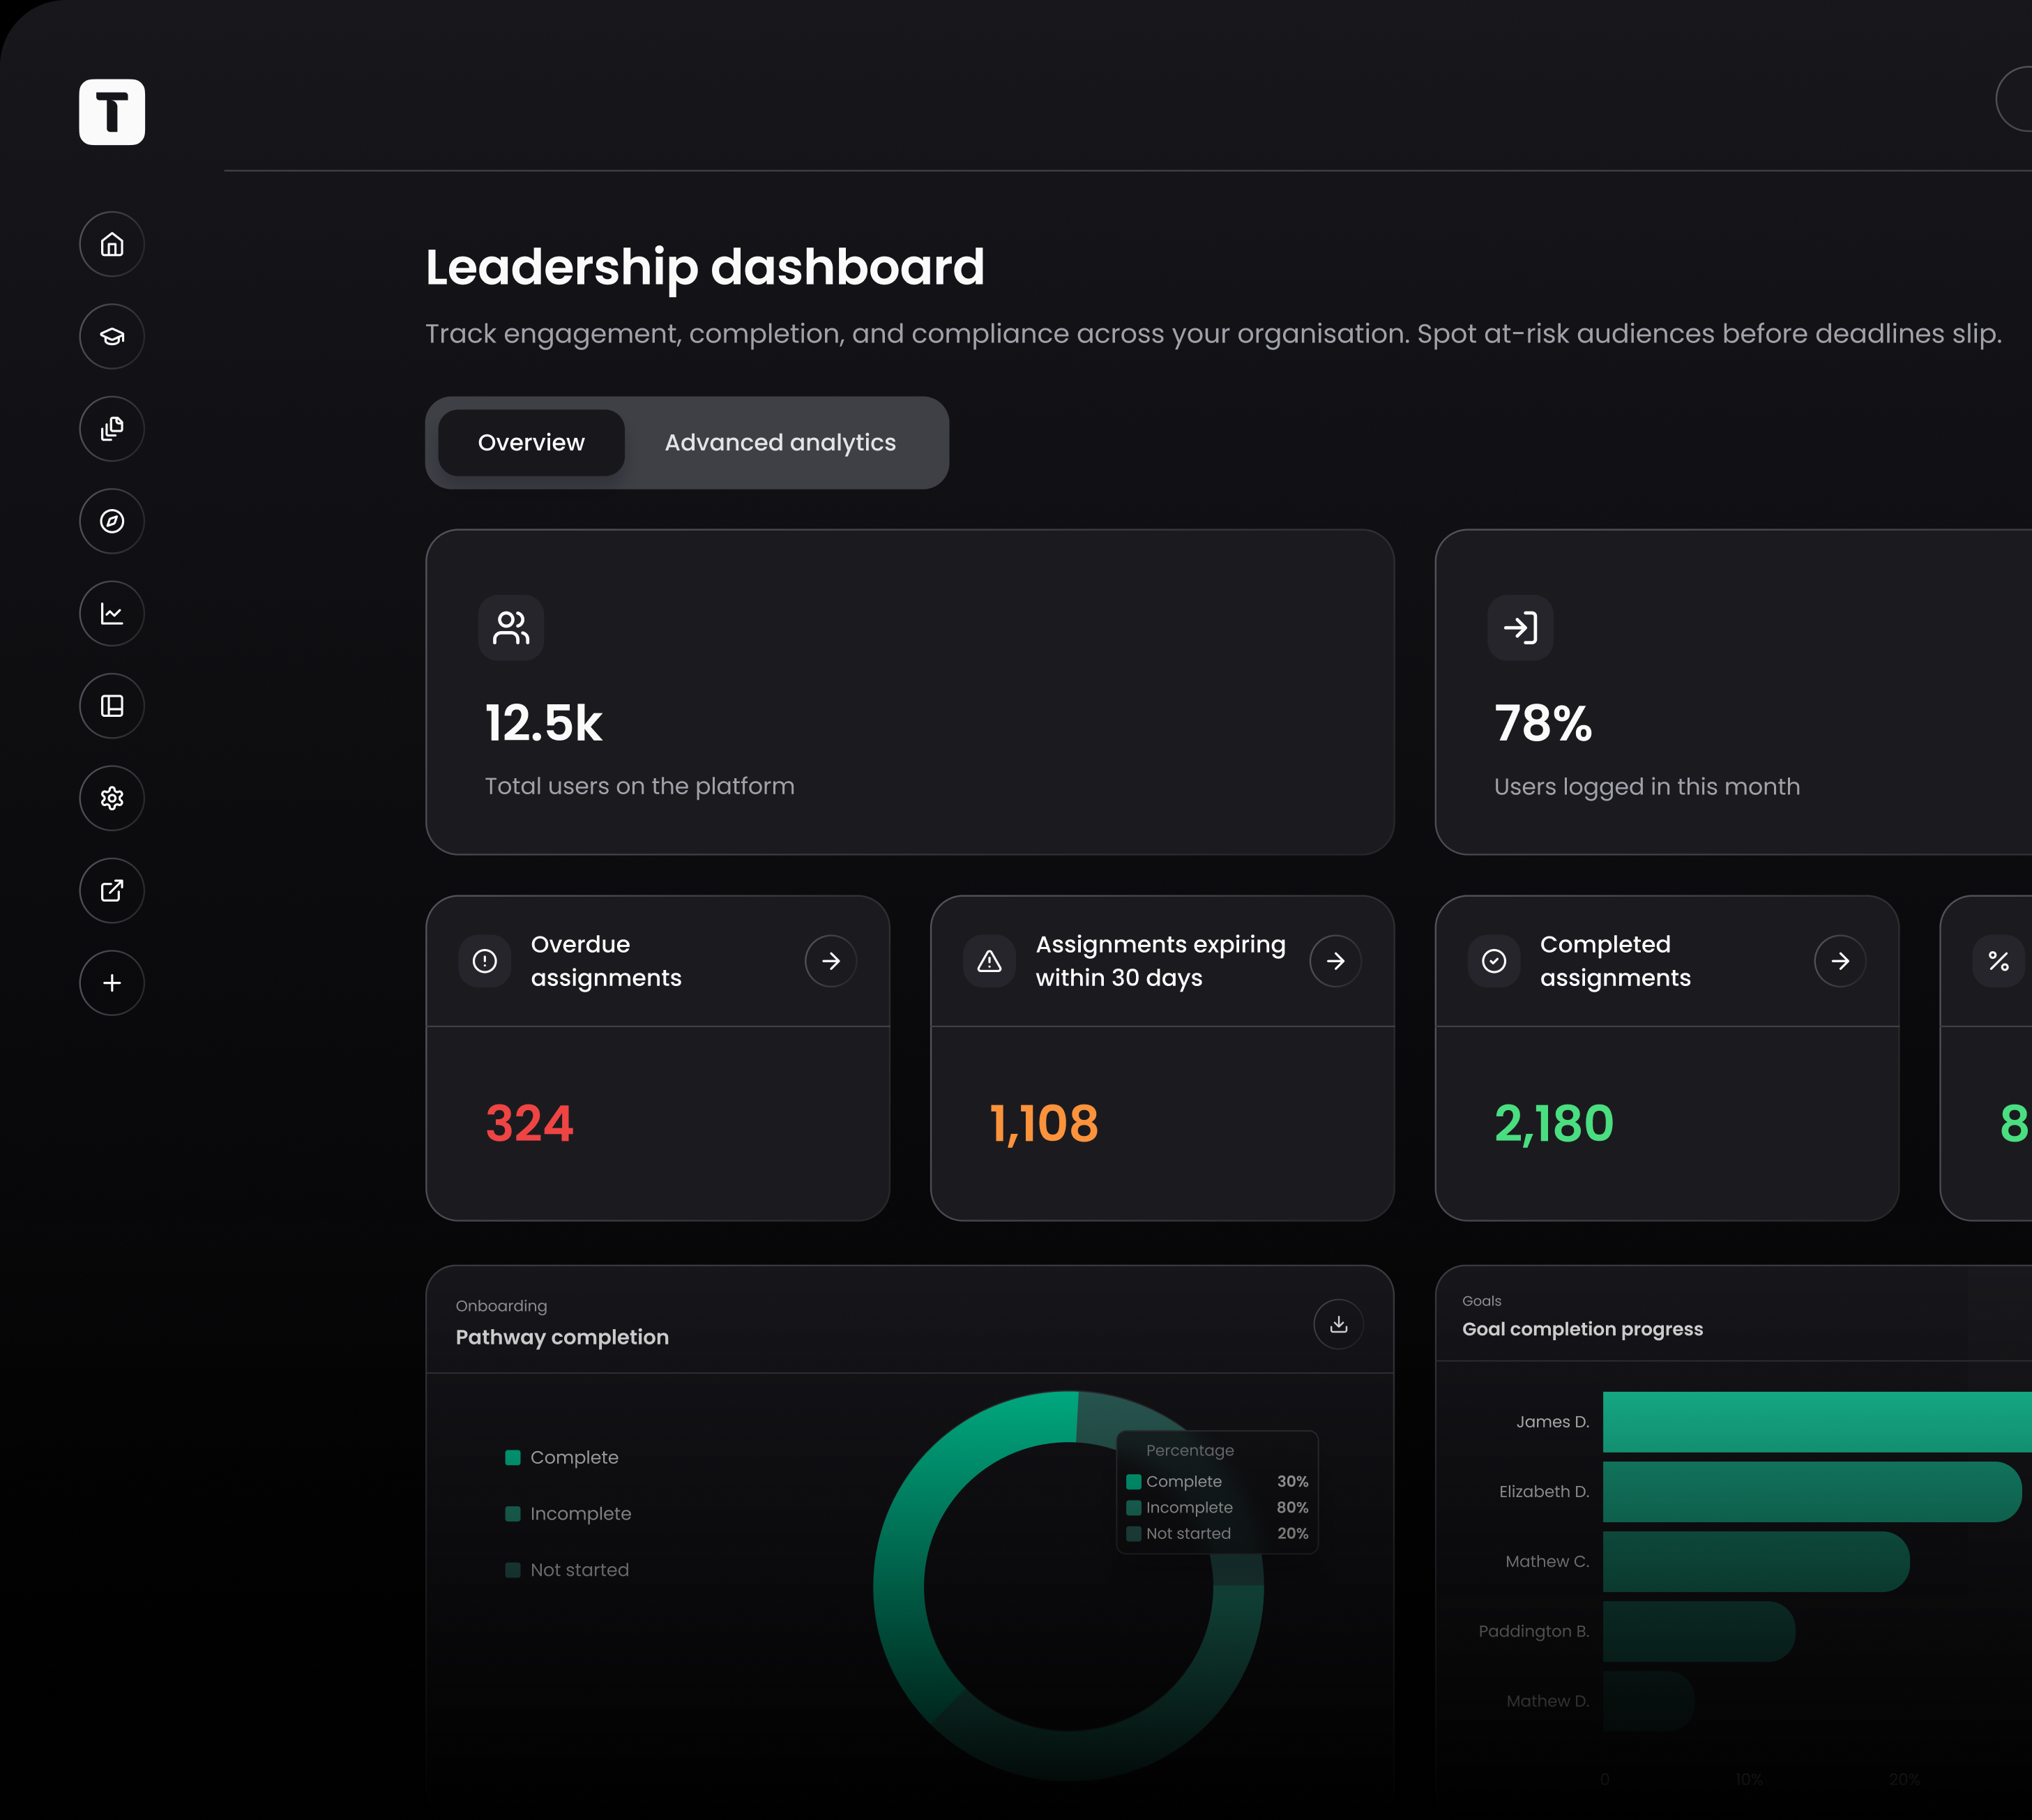
Stop exporting spreadsheets and stitching data together manually. Thrive gives you LMS data analytics in real time, so you can spot trends, prove ROI and act on what the numbers are telling you.
.png)
.png)
See everything at a glance with customisable LMS dashboards built for L&D teams, managers and senior leaders. Filter by team, department, location or completion status to get the view you need instantly.
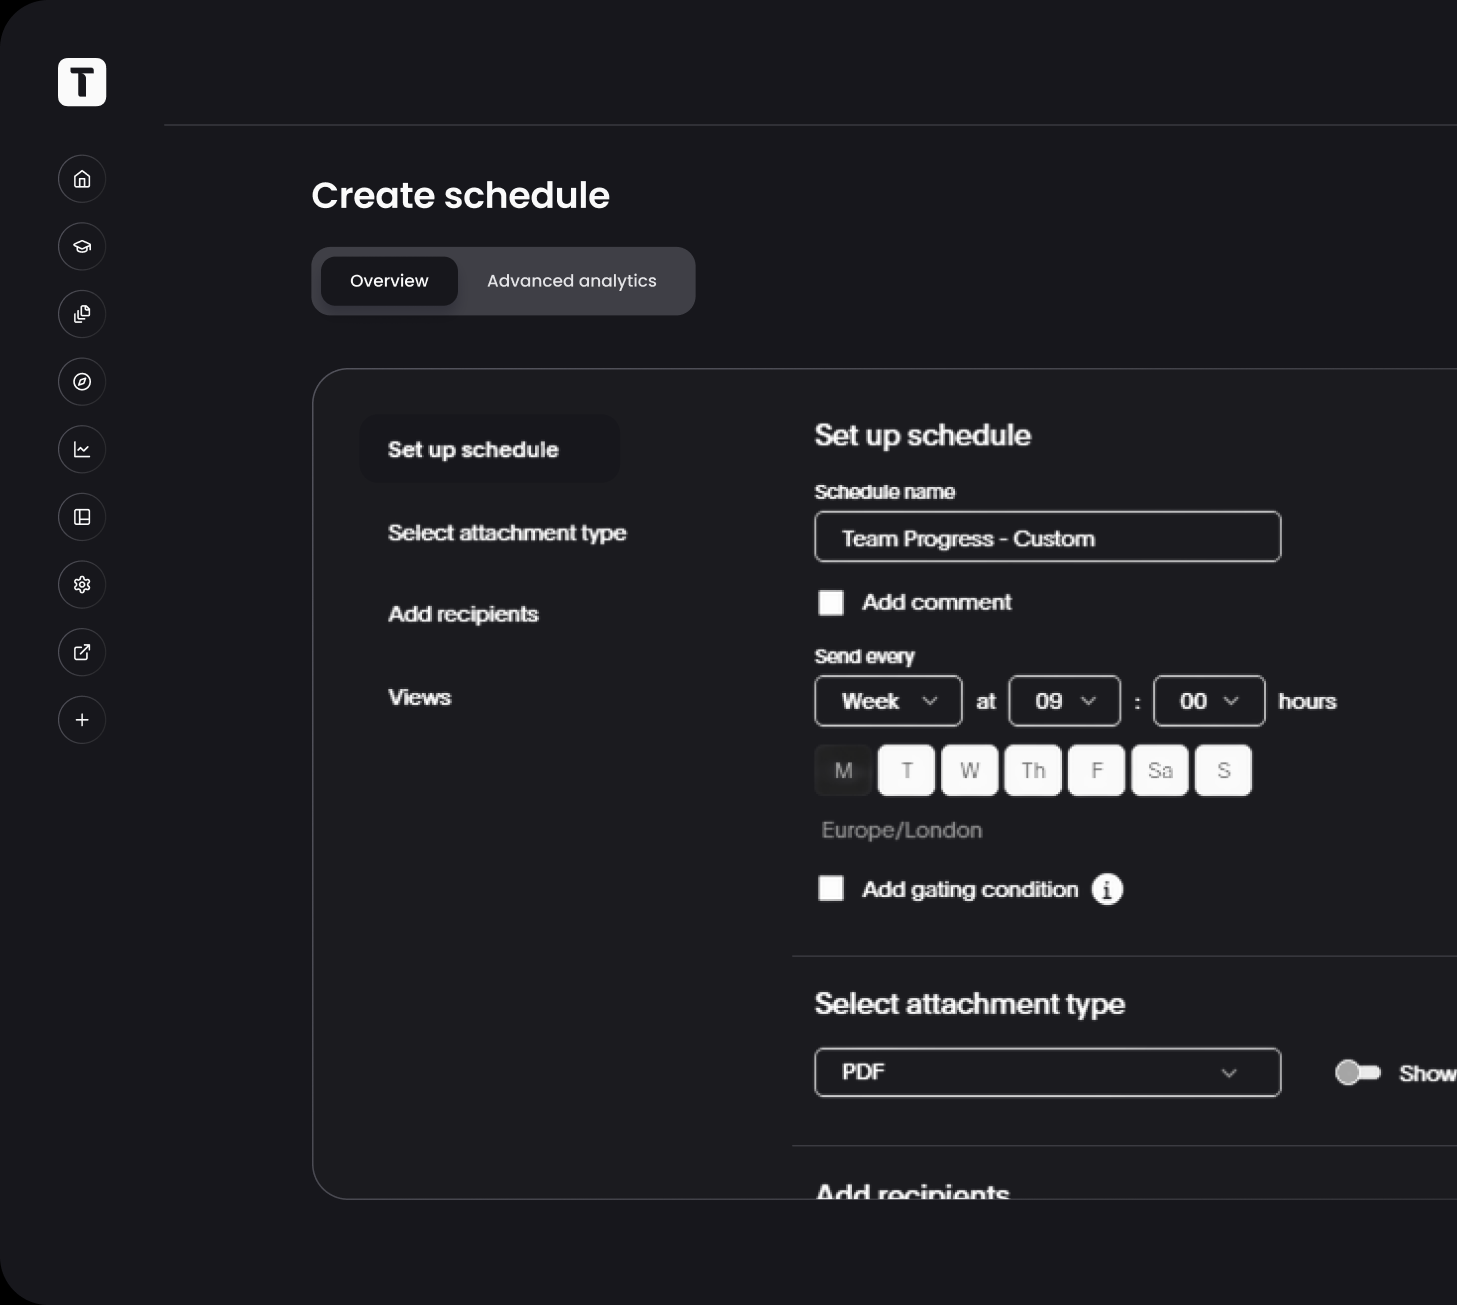
Schedule automated LMS reports, export to CSV or PDF, and share them with stakeholders on a cadence that works. Thrive's compliance reporting is audit-ready the moment you need it.
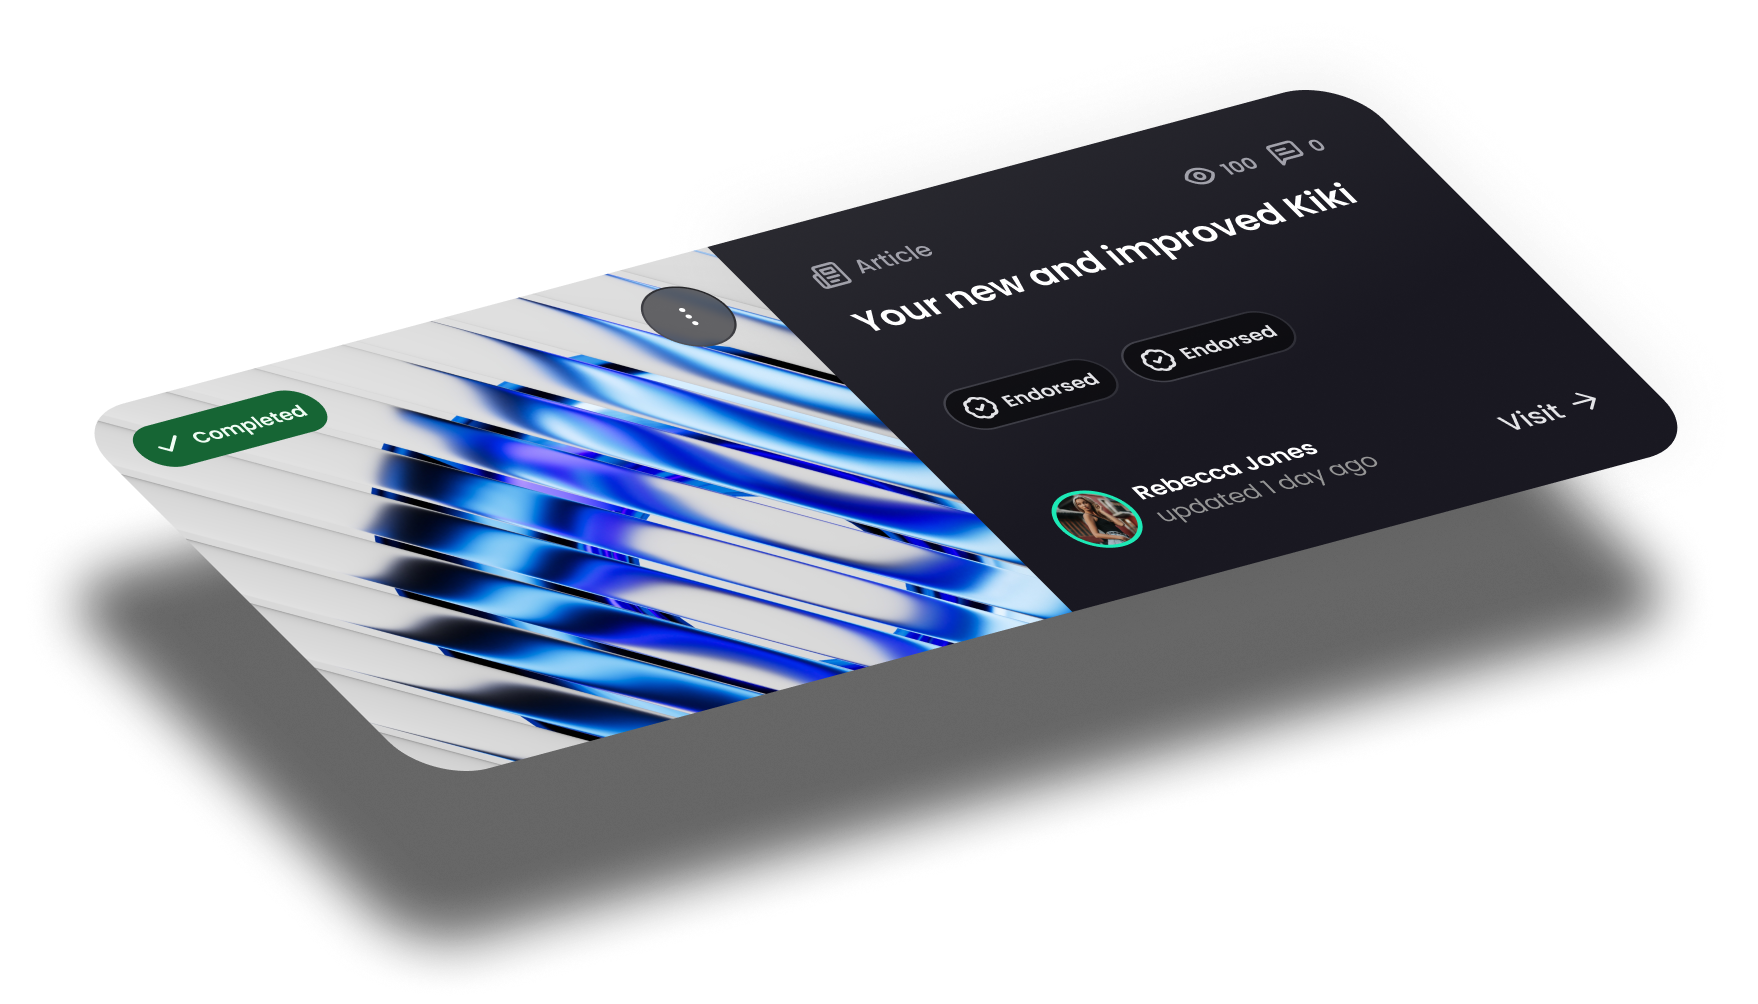
Track every learning interaction from course completions to content engagement, mentoring activity and event attendance. Connect learning data to performance outcomes and business results.
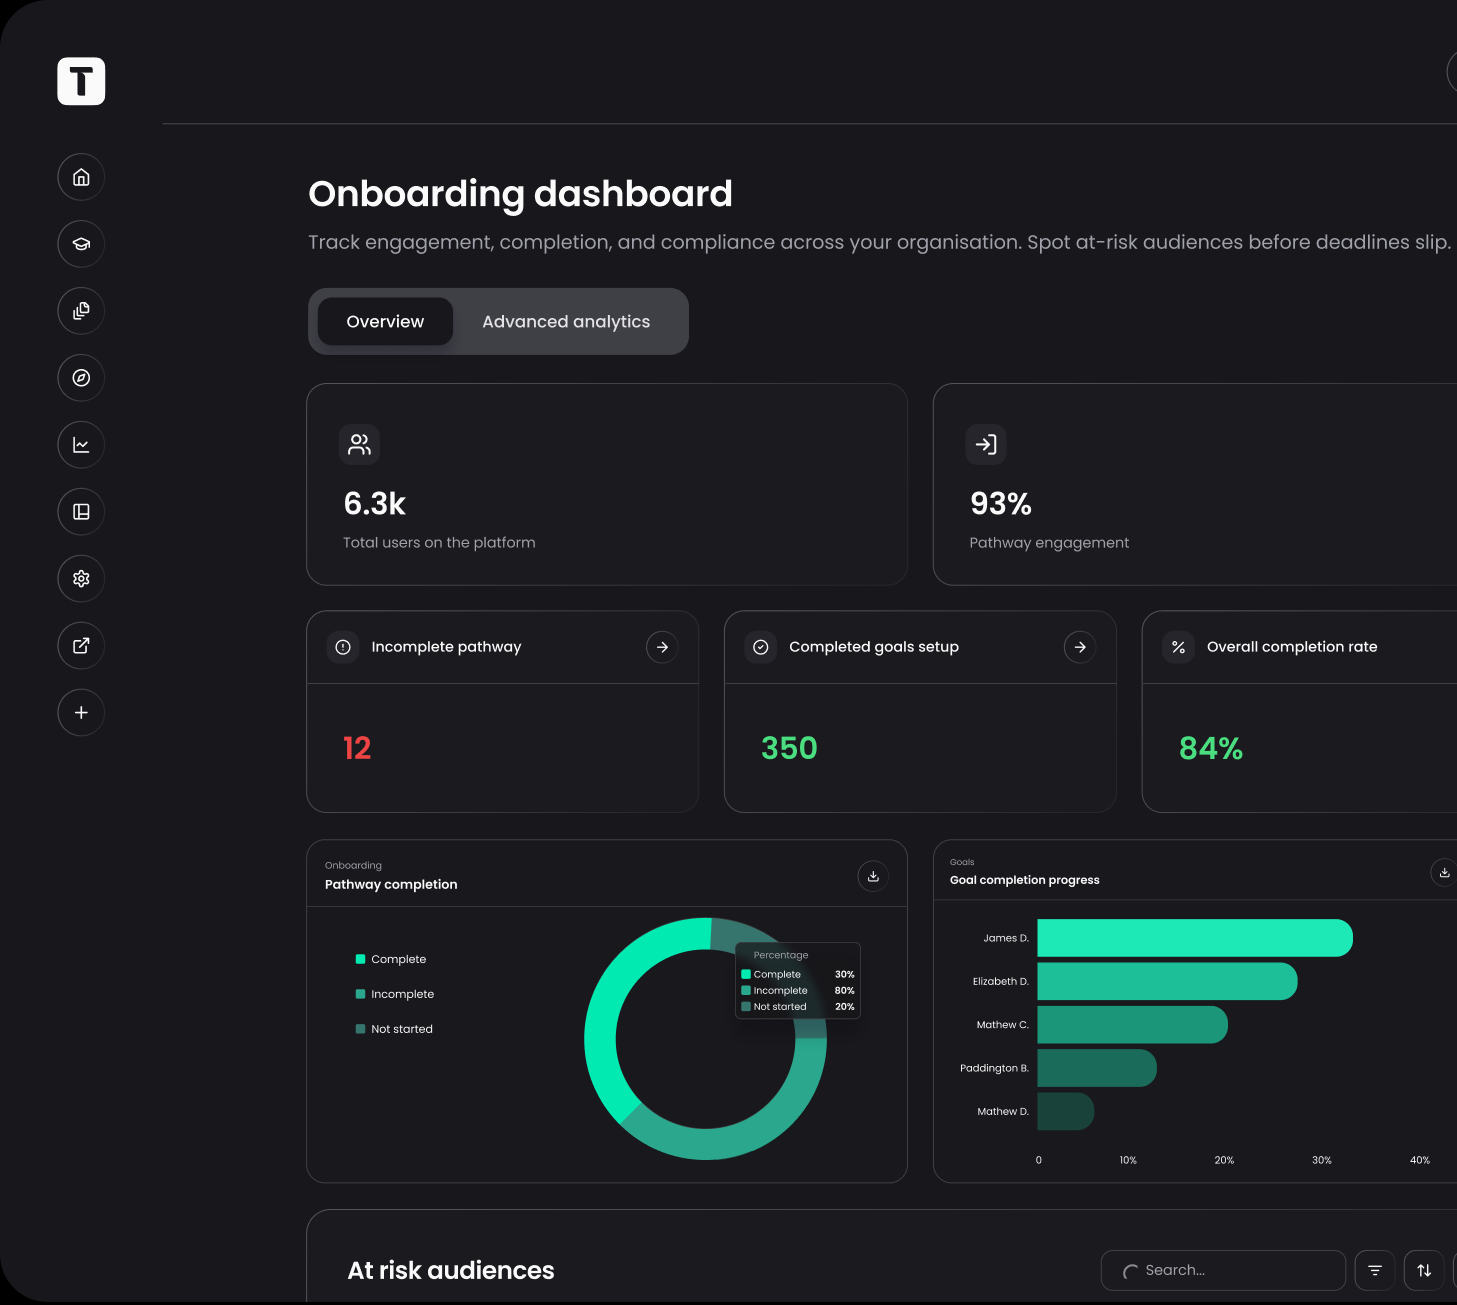
Give HR teams and line managers clear visibility of how new starters are progressing. LMS onboarding dashboards connect day-one completions to time-to-competency so you can act on what you see.
How are you going to use it?
Trusted by teams like yours





Frequently asked questions
What is learning analytics?
Learning analytics is the measurement, collection and analysis of data about learners and their contexts. In an LMS, it means tracking how people engage with training content, measuring completion rates, identifying skills gaps and using that data to improve learning programmes and business outcomes.
What is the difference between LMS analytics and LMS reporting?
LMS analytics focuses on interpreting patterns and trends in learner data to inform decisions. LMS reporting is about generating structured outputs like completion reports, compliance summaries and progress dashboards that can be shared with stakeholders. Most organisations need both working together.
What LMS reporting features should I look for?
Look for scheduled and automated reports, customisable dashboards, the ability to filter by team or region, export options like CSV and PDF, and real-time data rather than batch updates. Better LMS reporting saves L&D teams hours every week and gives leadership confidence in training ROI.
What are the best LMS platforms with built-in reporting and analytics in 2026?
The best LMS platforms with built-in reporting and analytics in 2026 include Thrive, Docebo, Cornerstone and TalentLMS. Thrive stands out with real-time dashboards, automated report scheduling, behaviour tracking, skills analytics and onboarding reporting without needing third-party tools or manual exports.
Explore more features to support your learning and development strategy
Set clear goals, track real progress and give every employee the tools they need to perform at their best.
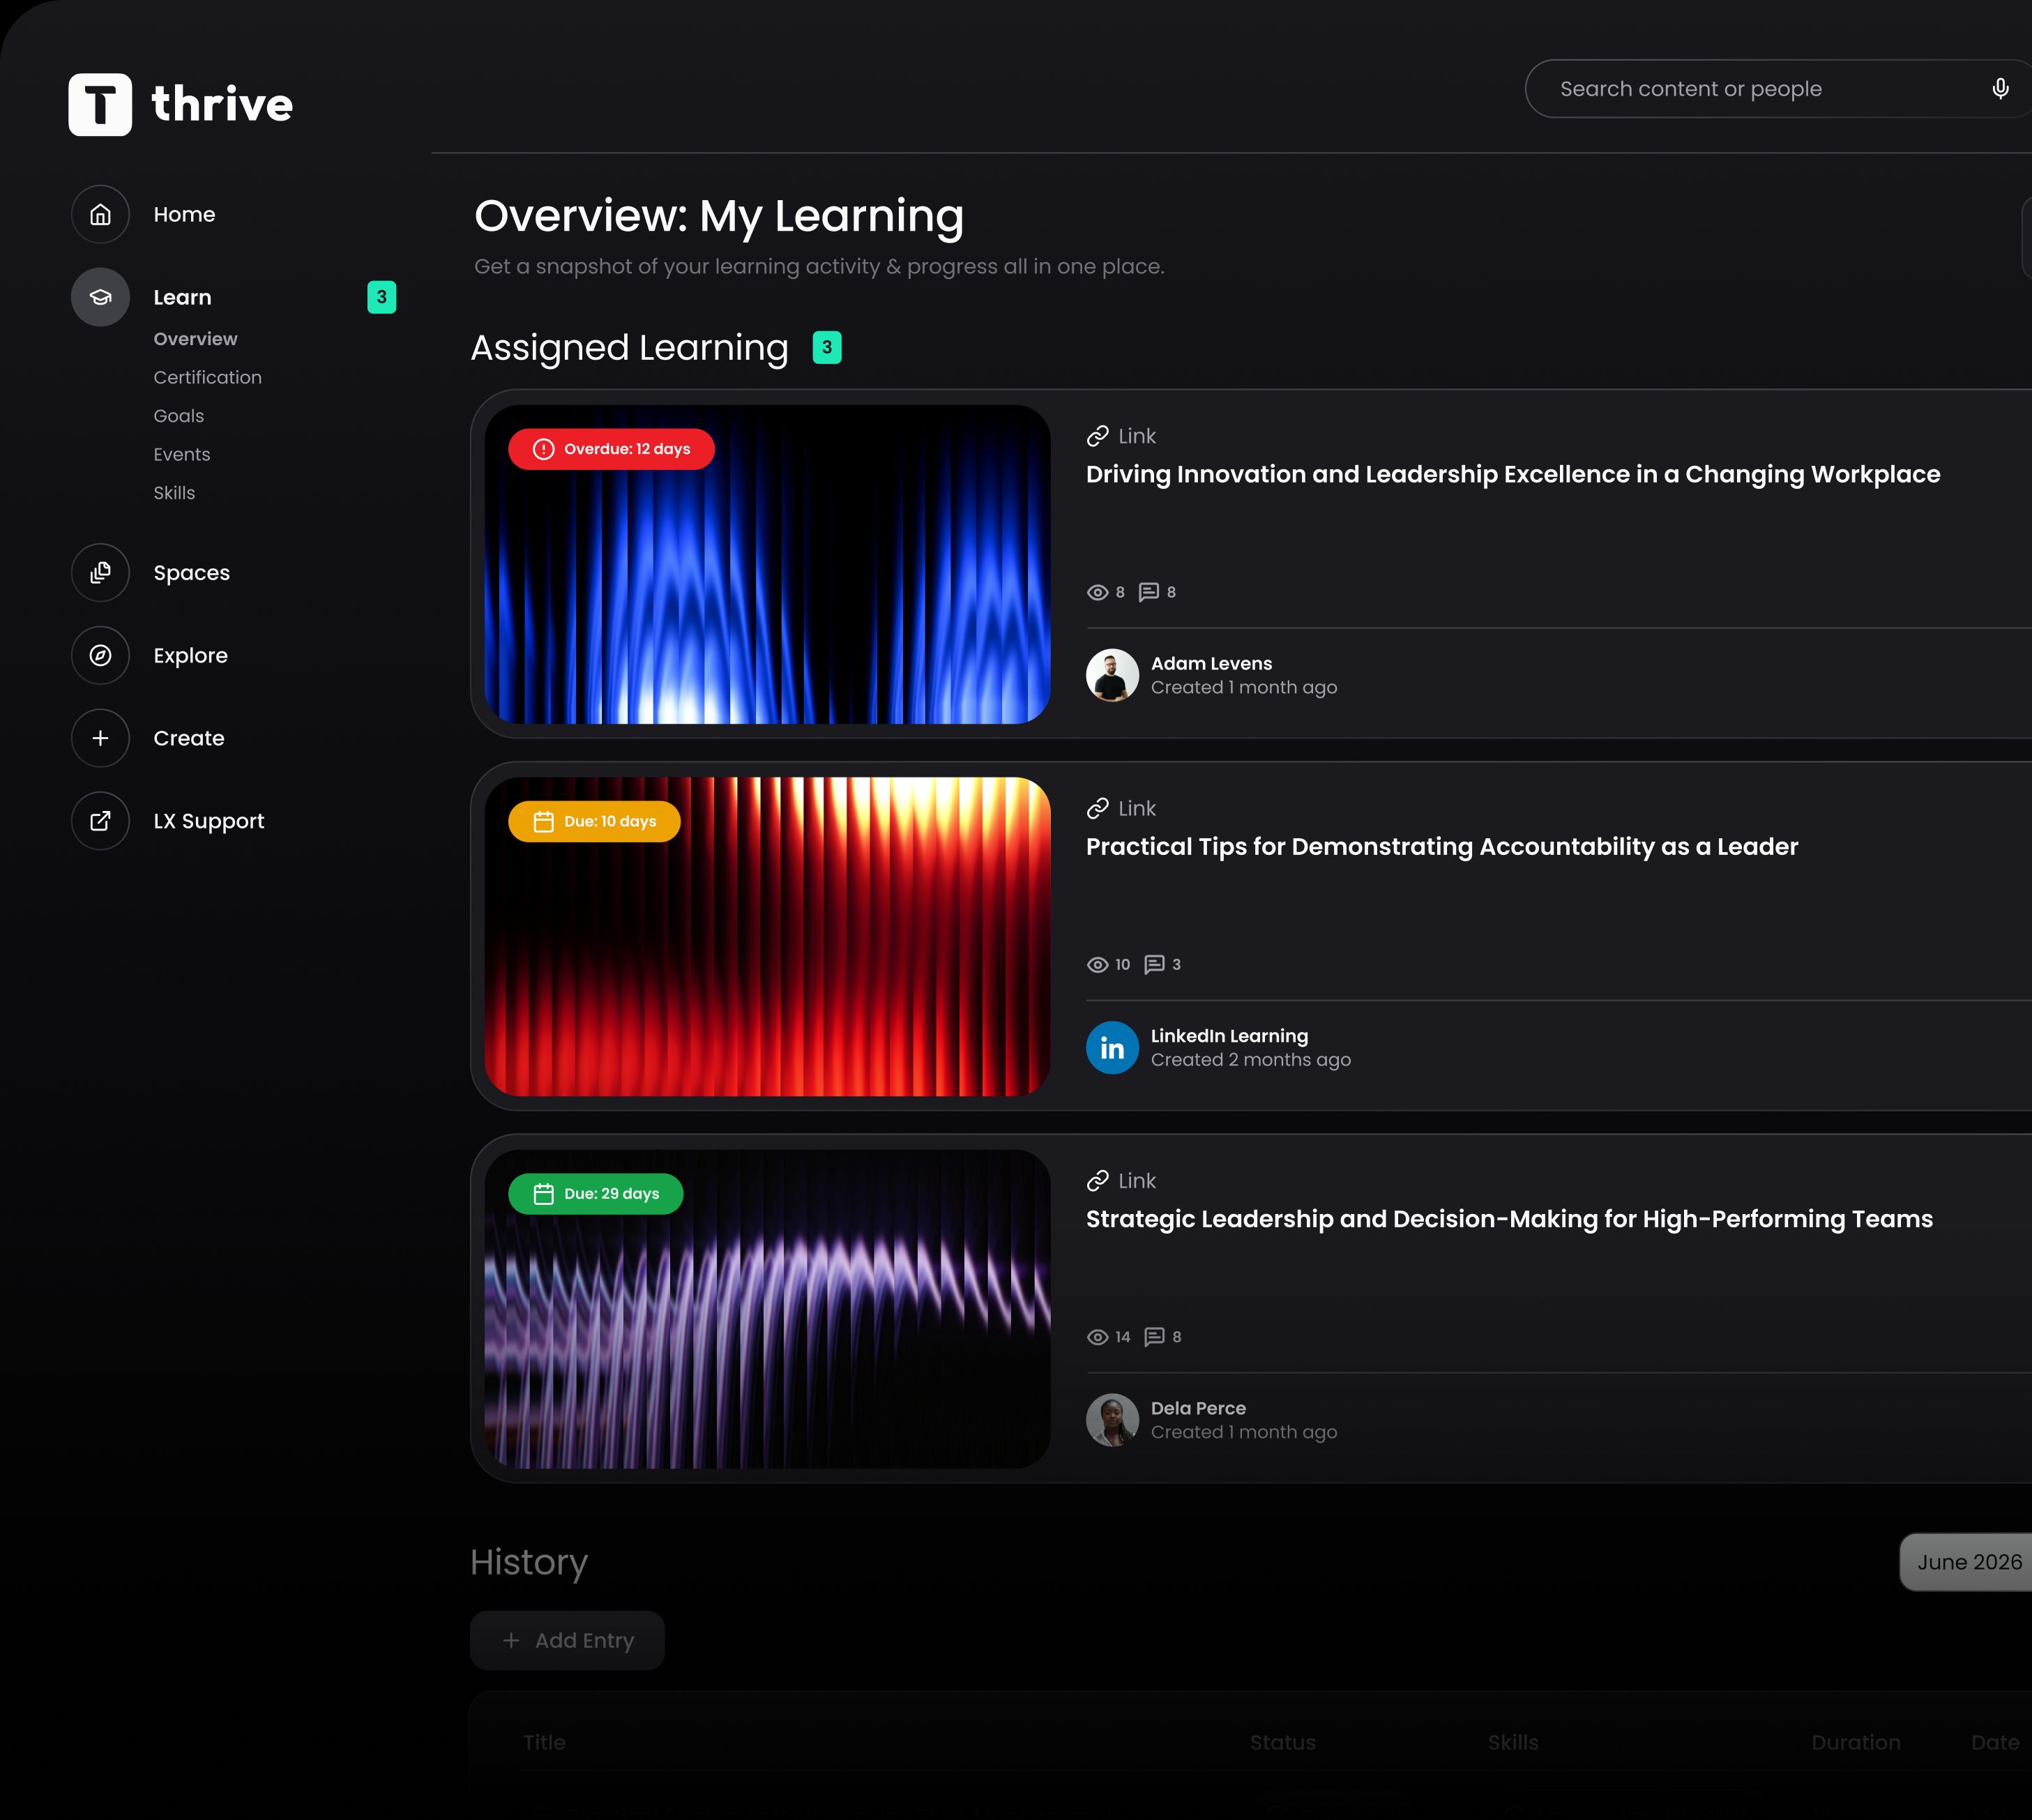
Build the skills your team needs with personalised recommendations, clear progression and meaningful goals.
.png)
Structured employee assessments, self assessments and knowledge tests connected to real skills and performance data.
.png)